Please note: the content of this page has not been updated to reflect changes data migration to Google Analytics 4. Your report may vary slightly. Please contact your account manager if you have any questions about your report.
Our client reports all follow the same format, though some reports will include additional pages depending on the scope of the project. Your report will include:
- Performance Overview
- Digital Marketing Summary
- Digital Advertising Summary
Your report may also include pages for the following:
- SEO Summary
- GMB & Off-Site SEO
- E-commerce
- Content Marketing
- Google Search Ads
- Google Display Ads
- Facebook Ads
- YouTube Ads
- LinkedIn Ads
Performance Overview
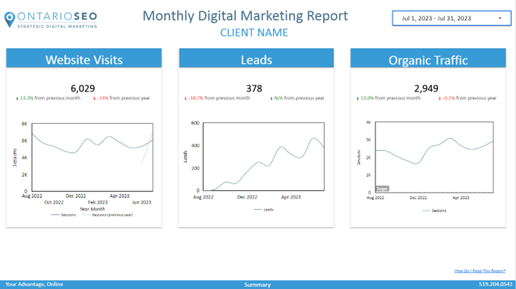
The performance overview page is the first page you will see in the report. It provides a high-level view on the key performance indicators (KPIs) of your project for the reporting month.
In each box you will find a key performance indicator reported for the month, along with the percentage change from the previous month (left) and the previous year (right). The graph displays data for the past year*, so the overall trend in the KPI can be seen clearly.
Each graph contains a “target”. Targets are set based on the KPIs of your project. In the absence of a client-specified goal, we set targets that are 10% above the average from the previous year.
The KPIs reported on this page can be customized at your request.
*If a full year of data is unavailable, the reporting window may be altered.
Digital Marketing Summary
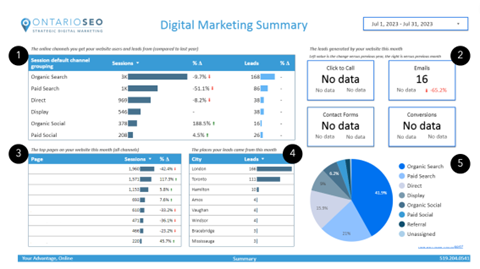
This page provides an overview of the results of your various digital marketing efforts relative to each other.
1. The online channels you get your website users and leads from (compared to last year)
This chart provides an overview on the website sessions and website leads generated by each marketing channel. The percentage change from the previous year is reported (when available).
Organic Search – visitors to your website from a search engine such as Google, Bing, or Yahoo.
Direct – visitors who went to your website by directly typing it in the navigation bar of their web browser.
Email – visitors to your website who arrived by clicking on a link in an email.
Paid Search – visitors to your website who arrived because of a click on a search engine advertisement.
Paid Social – visitors to your website from a Facebook, LinkedIn, or Instagram ad.
Referral – visitors to your website that came through a link on another website.
Social – visitors to your website from a link on a social media website such as Facebook.
2. The leads generated by your website this month
These are the conversion actions tracked through your website’s Google Analytics. An example of this would be a form submission or a click on a phone number. The total number of leads generated in the month is shown along with the percent change from the previous year (left) and month (right).
3. The top landing pages on your website this month (all channels)
A landing page is the webpage a user arrives on when they visit your website. In most reports the number of sessions (website visits) is shown along with the percent change from the previous year.
4. The places your leads came from this month
The cities that generated the most website leads in the month. When lead data is unavailable, session data may be used.
5. Percentage of website traffic from each channel
The following pie chart breaks down the percentage of online traffic coming to your website from each digital marketing channel.
Digital Advertising Summary
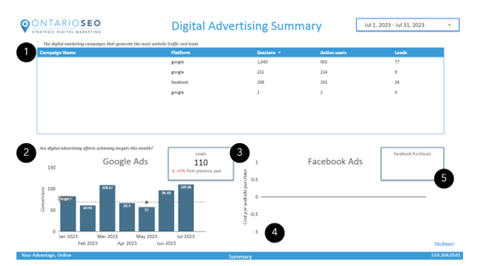
This page is the summary of all your paid digital advertising channels.
- A chart which contains all the campaigns that are tracked in your Google Analytics account. These may include, Google Ads (Google/CPC), Google My Business (Google/organic), Facebook Ads (Facebook/paid-social), LinkedIn (LinkedIn/paid-social) and email campaigns (XX/email).
- A chart showing the key-performance indicator for your Google Ads, usually leads or cost-per-lead, over the past 6 months. The target is set quarterly based on the performance in the previous quarter and the objectives of the campaign(s).
- The total number of leads tracked in the Google Ads account in the reporting month.
Note that this number may differ from the numbers reported in chart 1 because they are different data sources. For example, Calls from Ads are tracked as a lead in Google Ads, but not in Google Analytics (since the user does not visit the website). - A chart showing the key performance indicator for your Facebook or LinkedIn Ads over the past 6 months.
- The total number of leads tracked in the Facebook or LinkedIn Ad account in the reporting month.
The accuracy of lead tracking depends on a variety of factors including the Facebook pixel measurement framework on your website (what events are tracked) as well as the number of users that have “allowed” tracking by the Facebook app (iOS users).
SEO Summary
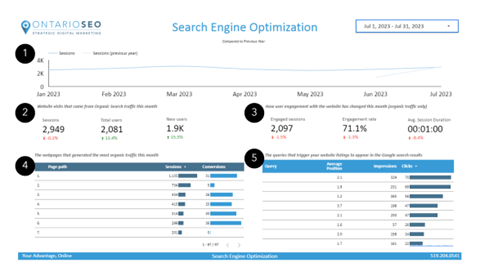
This report shows the progress of the website’s organic traffic (traffic from search engines). This detailed report is only included for clients with an SEO component to their project.
- Organic website traffic over the last 6 months compared to the previous year. Organic traffic is website visits that originate from the search engine results pages.
- Website visits that came from Organic Search traffic this month
Sessions – the total number of organic website visits in the month compared to the previous year.
Total Users – the total number of individuals that triggered events on your website during an organic session.
New Users – the total number of new organic website users that had not previously visited your website. - How user engagement with the website has changed this month (organic traffic only)
Engaged Sessions – the total number of organic sessions that lasted 10+ seconds, or had 1+ conversion events, or 2+ page/screen views.
Engagement Rate – the percentage of engaged sessions. This metric can also be understood as the opposite of bounce rate.
Average Session Duration – the average amount of time (in seconds) that a user engaged in a session on your website. - The webpages listed in the search engine results that generated the most traffic this month
This chart lists your top organic landing pages based on the number of sessions or leads. It is common for the homepage to appear first in this list.
5. The queries that trigger your website listings to appear in the Google Search results
This chart is derived from Google Search Console data and shows the specific searches that were used to find your website.
Query – the string the user typed into the Google Search.
Average Position – the average placement of your website listing in the Google Search results. Generally, only listings below 6 appear on the first page of the search results.
Impressions – the number of times your listing appeared in the search results page for a given query.
Clicks – the estimated number of clicks from the Google Search results through to your website for the given query.
GBP & Off-Site SEO
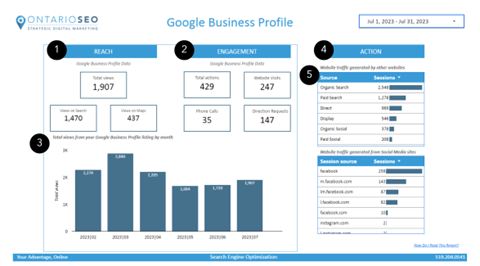
This report provides an overview of the performance of your Google My Business listings and other offsite channels such as website referrals and social network referrals.
1. Google Business Profile Reach Metrics
This data is from Google Business Profile
Total Views – the total number of times your Google Business Profile listing was viewed.
Views on Search – the number of times your Google Business Profile listing was viewed in the Google Search results.
Views on Maps – the number of times your Google Business Profile listing was viewed in the Google Maps results.
2. Google Business Profile Engagement Metrics
This data is from Google Business Profile
Phone Calls – the number of clicks on the phone number in your Google Business Profile Listing.
Directions – the number of clicks on the directions icon in your Google Business Profile Listing.
Website Clicks – the number of clicks on the website icon in your Google Business Profile Listing.
Photo Views – the number of times a photo on your Google Business Profile listing was displayed or viewed. This chart shows the total number of Google Business Profile listing views over the past year.
3. Website Actions
This data is from Google Analytics (your website)
Website Visits – the number of users that visited your website by clicking on an element in a Google Business Profile listing.
Leads – the number of times a conversion action was taken on the website. For example, a form submission.
4. Website traffic generated by other websites
This data is from Google Analytics.
These charts provide a list of other websites that have directed traffic to your website.
Google Search Ads/Google Display Ads
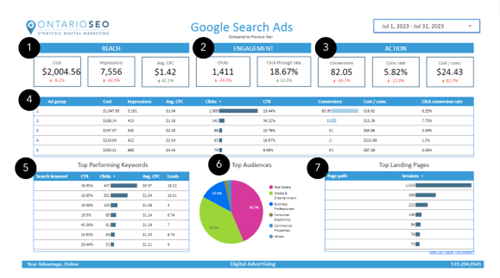
This report provides a detailed look at the performance of your Google Ads Search campaigns in the reporting month. The percentage change is shown below each metric and may be compared to the previous month or the previous year depending on the account.
- Reach Metrics
These metrics indicate how visible your ads were in the month.
Cost – the total cost of Search Ad clicks in Google Ads.
Impressions – the number of times ads were displayed.
Average CPC – the average cost for Search Ad clicks in the month. - Engagement Metrics
These metrics indicate how engaging the ads were.
Clicks – the number of times the Google Search Ads were clicked.
CTR – (Click-Through-Rate) the number of times the ad was clicked relative to the number of times the ad was displayed. - Action Metrics
These metrics indicate if the ads drove action (leads).
Conversions – the number of leads that can be attributed to a click on a Google Ad. Conversions are tracked in the Google Ads interface and may differ from leads reported in Google Analytics.
Conversion Rate – the percentage of ad clicks that resulted in a lead.
Cost per conversion – the average cost of generating a lead. The total cost of clicks divided by the number of leads generated. - Ad Group Chart
This table allows you to compare performance metrics of multiple search campaigns and/or ad groups. - Top Performing Keywords
This chart lists performance metrics for individual keywords that are targeted by the Google Search campaigns. - Top Audiences
This chart displays the proportion of traffic from Google-defined user audiences. This data is often limited in smaller accounts. - Top Landing Pages
Google Analytics data
This chart shows the top landing pages that users see after clicking on a Search Ad.
Facebook Ads/LinkedIn Ads
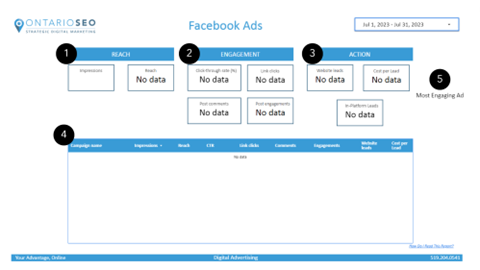
- Reach Metrics
Impressions – the number of times the Facebook ads were displayed
Reach – the number of people who have seen a post from your business
Ad spend – the total amount spent on ads in the reporting month. - Engagement Metrics
CTR – (Click-through-rate) the number of times an ad was clicked relative to the number of times the ad was displayed.
Link Clicks – the number of times a user interacted with an ad and clicked through to the website.
Post Comments – the number of individual comments on your paid ads.
Post Engagements – the number of times a user engaged with your ad by liking or sharing it. - Action Metrics
Leads – a lead is a defined action you would like users to take on your website. Leads can include phone calls, form submissions and emails.
Purchases – a purchase is a transaction recorded through your website.
Cost Per Lead /Purchase – the average cost of generating a lead or purchase through a Facebook ad, calculated by dividing the total cost by the number of leads generated. - This chart contains the previous metrics broken down by campaign.
- Most Engaging Ad – the ad with the most clicks. Please note that carousel ads cannot be displayed in this report.
Contact Ontario SEO
Have questions? Check out our digital marketing blog post on Comparing Metrics in Universal Analytics to GA4. If you still need help understanding your report, please feel free to email or call your Account Manager.