Are you struggling to navigate the new Google Analytics 4 (GA4) interface? Do you want to understand how to use GA4 to gain insights into your website’s performance? The release of GA4 has caused a lot of confusion and anxiety for digital marketers and website owners. The new platform comes with a completely revamped interface and new features that can be overwhelming for those used to Universal Analytics. In this guide, we will break down everything you need to know about GA4, including its metrics, traffic filters, audiences, segmenting data and much more.
Navigating GA4
Navigating GA4 differs significantly from Universal Analytics, although there are some similarities. It is crucial to gain a comprehensive understanding of how to navigate the platform effectively in order to extract precise insights.
Navigating GA4’s Home Dashboard
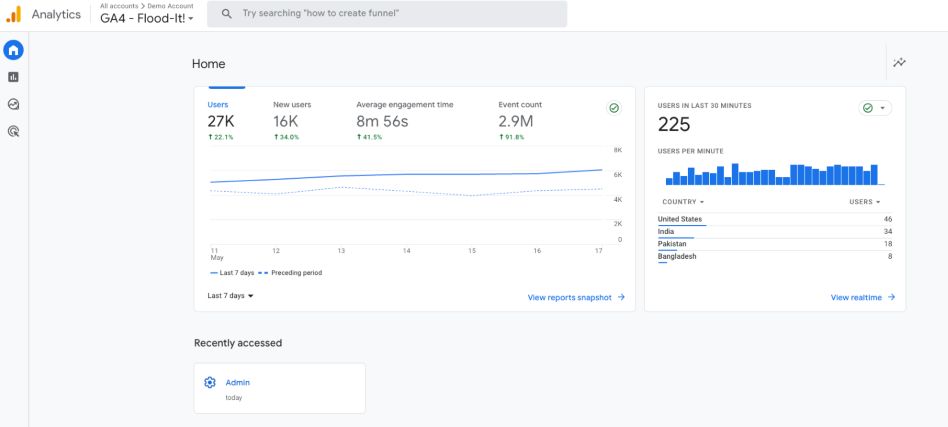
The home dashboard is the first page you see when you log in to your Google Analytics account. This dashboard provides a general overview of your site or app’s data. This page will provide more personalized content the more you use your analytics property. On your home page, you will find the following data cards and sections:
- Overview – this card shows metrics that are relevant to you with a trendline for each metric from the past 7 days.
- Realtime – this card shows activity as it happens using data from the Realtime report.
- Recently accessed – this card shows links to parts of your account that you accessed most recently.
- Suggested for you – this section includes cards that you view often, even if you haven’t viewed them recently.
- Insights and recommendations – this section will likely be blank if you set up your property recently. The insights card will show unusual changes, emerging trends, and other insights about your site or app. On the other hand, the recommendations section will provide tailored suggestions for the most useful and accurate data.
Navigating GA4 Reports
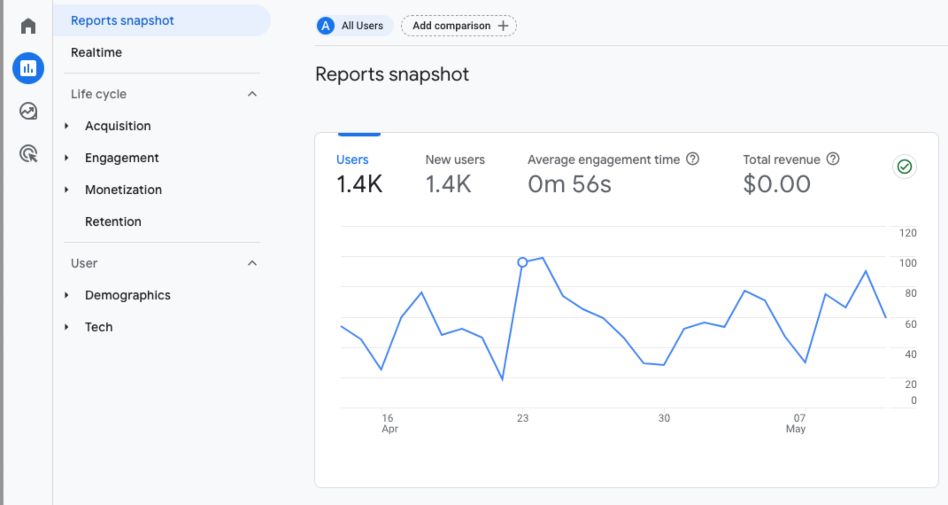
The Reports section of GA4 can be accessed via the left-hand menu, underneath the home tab. In this section, you’ll be able to look at the following:
- Reports snapshot – by default, this report gives an overview of your site or app’s data including users, insights, acquisition channels, etc. This report can be customized to show the data you care about most.
- Realtime – This report shows you real-time data including the number of users, audiences, user source, page views, events, and conversions that are currently taking place on your site or app.
- Life Cycle Reports – This is a set of reports that are designed to help marketers better understand each stage in the customer journey. These reports include:
- Acquisition: This section allows you to see where your site or app’s users and sessions are coming from.
- Engagement: This section allows you to see your site or app’s engagement data such as events, conversions, pages and screens, and landing pages.
- Monetization: This section allows you to see how your site or app’s revenue number of purchases, average purchase revenue per use, and other data points.
- Retention: This section allows you to view user retention data in terms of new and returning users, user retention by cohort, user engagement by cohort, user engagement, and lifetime value.
- User Reports – This is a set of user-related reports that provides demographic information (such as age, location, language, gender, and interests) as well as technology information (such as browser, screen resolution, app version, and operating system).
Navigating GA4’s Explore Tab
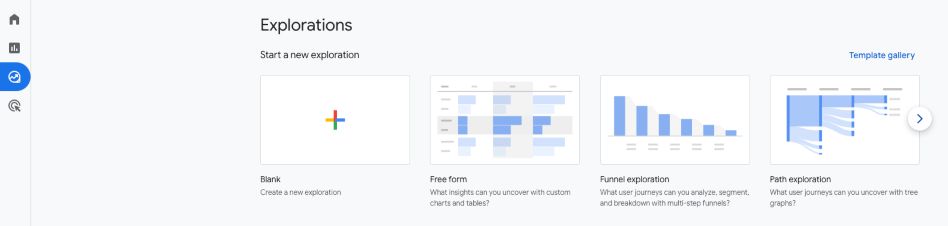
The Explore tab of GA4 can be accessed by hovering over the left-hand menu and clicking on Explore. Exploration Reports allow you to explore data that goes beyond the GA4’s reporting section. It also allows you to create your own custom explorations to gain more insight into your site or app’s data.
An exploration consists of 3 sections:
- Canvas – located on the right, this section displays your data using the selected technique. These techniques include:
- Free-form exploration: Explore data in a crosstab layout.
- Cohort exploration: Analyze the behaviour and performance of particular groups of users.
- Funnel exploration: Visualize the conversion funnel on your site or app to uncover which stages need your attention.
- Segment overlap: Explore how different use segments relate to each other.
- User exploration: Analyze the users from segments you create or import.
- Path exploration: Visualize the paths users take via interactions on your website or app.
- User lifetime: Uncover user behaviour and their value over their lifetime as a customer.
- Variables – located to the left, this panel provides access dimensions, metrics, and segments that can be used in the exploration.
- Tab Settings – this panel allows you to configure the selected tab such as choosing the technique and adding items from the variables panel.
Navigating GA4’s Advertising Tab
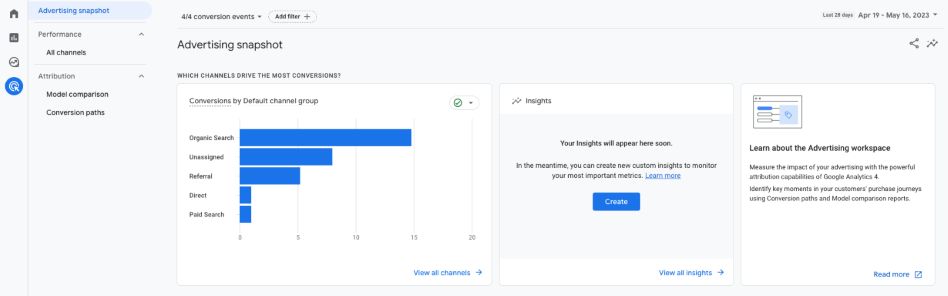
To access GA4’s advertising section, hover over the left-hand menu and click Advertising. In this section, you’ll be able to look at the following:
- Advertising Snapshot – this section provides an overview of your advertising performance and provides 3 summary cards: conversion by default channel group, conversion paths, and model comparison.
- Performance – this section helps you understand which channels and campaigns received conversion credit.
- Attribution – these reports provide marketers with insights on how their advertising efforts work together to drive conversions.
- Model Comparison: compare how different models impact the valuation of your marketing channels.
- Conversion Paths: view your customers’ paths to conversion and how different attribution models distribute credit no those paths.
Navigating GA4’s Admin View
GA4s admin view has many of the same settings as Universal Analytics, though there are several new ones you will want to get familiar with. To navigate to GA4’s Admin View, simply hover over the left-hand menu and click Admin (at the bottom of the menu).
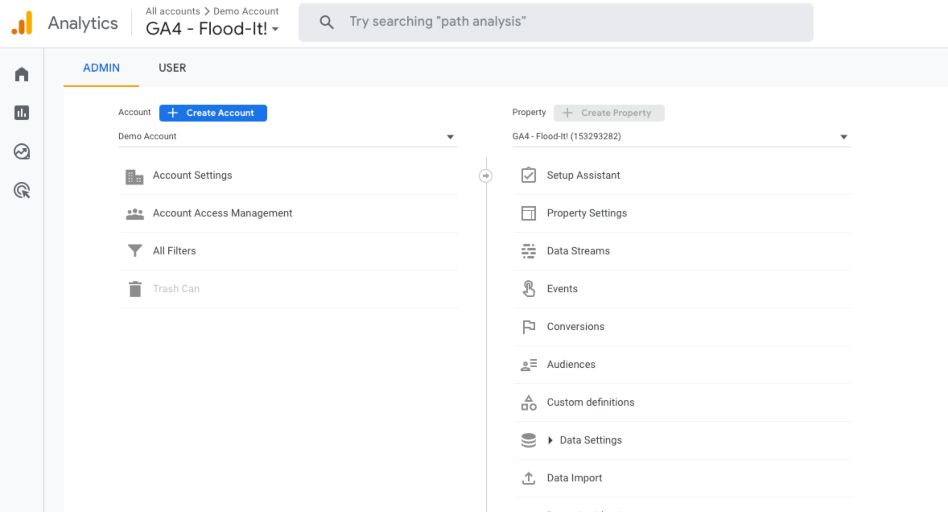
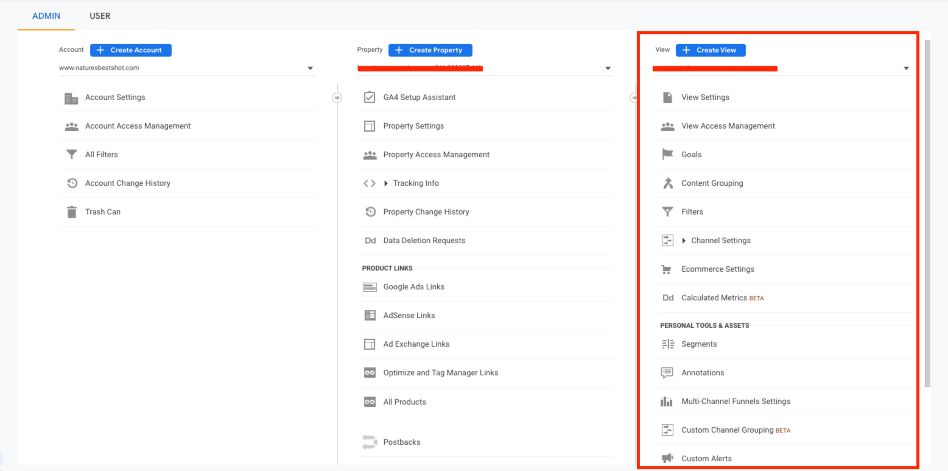
Now, the first difference you will notice between GA4’s admin settings and Universal Analytics admin settings is that there is no longer a Views column. This means that GA4 currently does not have the capability to create a view via its admin settings — though it is possible that Google is planning on adding this at a later date.
In GA4’s admin view, you will be able to update your admin settings and user settings. In the Admin settings tab, you’ll see the following columns:
- Account Settings – these are the settings that are specific to your GA4 account and are pretty much the same as GA3:
- Account Settings: review your account name, country, ID, data sharing settings and more.
- Account Access Management: manage your GA4 property’s account permissions.
- All Filters: review and manage the property filters you have set up.
- Trash Can: view deleted items.
- Property Settings – these are the settings that are specific to your GA4 property, some of the setting types have been carried over from GA3, but you’ll find that there are many new settings in this section:
- Set Up Assistant (new): provides the settings you need to finish configuring your GA4 property such as data collection, property settings, Google Ads, etc.
- Property Settings: provides property details such as the name, industry category, reporting time zone, currency, and property ID.
- Data Streams (new): allows you to set up to 50 data streams (a flow of data from a customer touchpoint to analytics)
- Events (new): lists the events that were triggered on your app or site during your active date range. You can click these events to see a detailed report for that specific event.
- Conversions (new): shows each event that’s marked as a conversion in the events table. It allows you to toggle conversions on and off and apply other settings.
- Audiences (new): allows you to analyze and create audiences.
- Custom definitions: allows you to create dimensions and metrics from event parameters and user properties so you can easily access data in reports and explorations.
- Data Settings (new): configure your data collection, data retention, data filters, and channel group settings.
- Data Import: upload data from external sources and join in with your analytics data.
- Reporting Identity (new): determines which methods analytics uses to associate events with users. There are two options: blended and observed.
- Attribution Settings (new): choose your reporting attribution model and lookback windows.
- DebugView (new): displays the events and user properties that analytics collects from a user in real-time, allowing you to troubleshoot issues as you install event tracking. Must be enabled to use.
- Product Links: link your analytics account to other products including Google Ads, Ad Manager, BigQuery, Merchant Center, and more.
In the user settings in GA4’s Admin view, you’ll find the same settings you would find in GA3. Here, you can configure your account information (such as email address, language, and default date range) as well as opt in and out of Google Analytics email communications.
GA4 metrics
There are many differences between the metrics available to you in Google Analytics 4 (GA4) and Universal Analytics (UA). Even when the metrics are called the same thing in both platforms, the way the hit data is collected usually differs. The fundamental difference between metrics in GA4 and UA is how hits are captured; while UA relied primarily on pageviews and events, GA4 is whole based on counting hits based on events. Both UA and GA4 call this a “Session”, but they are measured differently.
Comparing GA4 and UA metrics
| Metric | UA | GA4 |
|---|---|---|
| Users | Though calculated differently, the meaning of this metric is unchanged: Total number of users to your site | |
| New Users | Though calculated differently, the meaning of this metric is unchanged: Number of users who interacted with your site for the first time | |
| Active Users | Not Available | Number of users who has an “engaged session” or when a first_visit, first_open or user_engagement event is logged. |
| Pageviews/ Views | Total number of pages viewed. Repeated views of a page are counted each time. | Same as UA, except it also includes screen views in apps. |
| Unique pageviews | Duplicate pageviews in a session are not counted | N/A |
| Sessions | Period of time a person is actively engaged with your website or app (usually defined as 30 minutes). See below. | The number of times the session_start event is fired. Calculated differently than UA sessions. |
| Engaged Sessions | N/A | A session that lasts 10 seconds or longer, has 1 or more conversion events OR has 2 or more pageviews. |
| Bounce Rate | Percentage of single-page sessions on a site. | Percentage of sessions that were not “engaged sessions” |
| Events/Event Count | An event is trigged when a defined action occurs on your site. UA events must include a category and action parameter. | Every “hit” in GA4 is an event. Events in GA4 have no required notations, but can have parameters appeneded. These can be used to easily differentiate unique actions. GA4 automatically collects some pre-defined events. |
| Conversions | In UA you define a “Goal” to reflect a conversion action. UA only counts ONE conversion per session for each goal | In GA4 you can specify certain events as conversion events. GA4 counts every conversion event. |
| Purchases | Though calculated differently, the meaning of this metric is unchanged: Total number of purchase events fired on your website. | |
How are Sessions Measured Differently in GA4?
In UA, a new session begins when:
- A user visits your site
- A user visits your site from a new traffic or source/medium
A session in UA ends after 30 minutes of inactivity from the user or the timestamp has restarted at midnight (according to your time zone in analytics).
In GA4, sessions now come from the Event called session_start. That event gets triggered the same way it does in UA. The two main differences between GA4 and UA are:
- Sessions do not restart at midnight
- Sessions do not restart when new campaign parameters are encountered
This change means that session data is easier to understand but it does impact your data and reporting, especially if users visit your website through multiple sources.
Will My Session Data in UA Match GA4?
Probably not. There are a variety of reasons why your session data will never completely match between the two analytics platforms. Google themselves even mentions that sessions in GA4 may be different compared to UA so don’t go in expecting that it’s going to be an exact match.
We’ve found that a good threshold when comparing the two is an 8% difference. If you see anything 8% or smaller when comparing, things are probably running as they should be. Differences between 8-20% mean that you should probably look for what could be causing the discrepancy. If you’re noticing that the data is showing a 20% difference between GA4 and UA, then something is wrong and should be looked at immediately.
Let’s look at some specific reasons why session data between GA4 and UA usually won’t match up.
Sessions Can Start with User Engagements
In GA4, sessions can start without a pageview or screenview. A session can be triggered by user engagement. Here is an example to explain this further:
You land on a blog about cooking mashed potatoes. As soon as you land on the site, you immediately go back to Google and look at other blogs for 45 minutes. You end up liking the first recipe and decide to go back and read the recipe and scrolled to the bottom of the page to read the comments. Afterward, you closed the tab.
In UA, that would likely count as two sessions. Each session started with a pageview.
In GA4, that scenario would count as two sessions. The first session would be triggered by a pageview. The other session would be started when you came back to the page and restarted with a user engagement, such as scrolling.
Conversion tracking in GA4
Conversion tracking in GA4 is much more straightforward than goal tracking was in Universal Analytics. In its simplest implementation, you can track conversions simply by toggling “on” relevant events in your Events report.
- Go to Admin
- Under “Property”, select “Events”
- Toggle on “Mark as conversion”
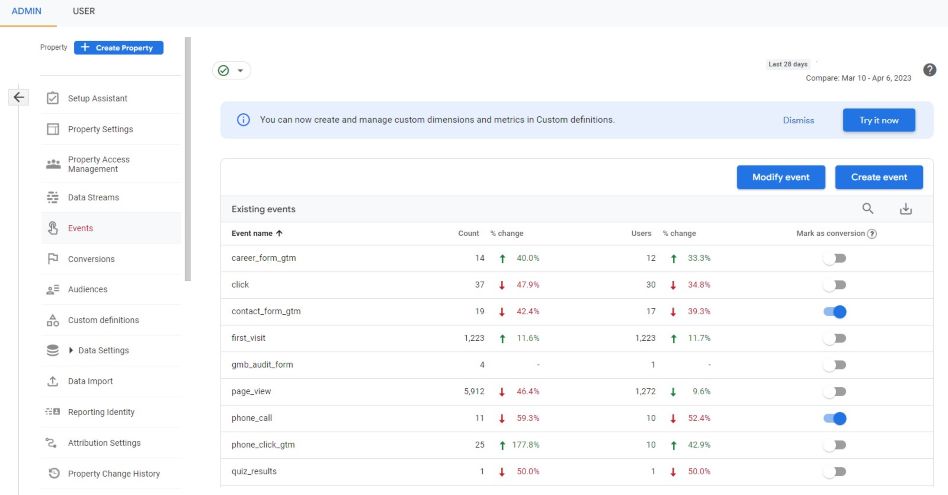
Here comes the tricky part. Before you turn an event into a conversion, make sure you understand what that event is tracking. There are several standard events that GA4 can automatically track based on common website elements. You can also create your own events (especially if you are migrating a UA account). If you are not cautious at this step, you can create duplication in your measurement framework.
Automatically Tracked Events in GA4
| Event | Trigger | Parameters |
|---|---|---|
| click | Each time a user clicks a link to a new domain | link_classes, link_domain, link_id, link_url |
| file_download | When a user clicks a link that leads to a file (with a common extension type) i.e. a PDF or text document | file_extension, file_name link_classes, link_domain, link_id, link_text, link_url |
| form_start | The first time a user interacts with a form in a session | form_id, form_name, form_destination |
| form_submit | When a user submits a form. You can use parameters from this event if you create custom dimensions for them. | form_id, form_name, form_destination, form_submit_text |
| page_view | Each time a page loads in the browser | page_location (page URL), page_referrer (previous page URL), engagement_time_msec |
| scroll | The first time a suer reaches the bottom of each page (90% vertical depth is visible) | engagement_time_msec |
| video_start | When a video starts playing | video_current_time, video_duration, video_percent, video_provider, video_title, video_url, visible (boolean) |
| video_complete | When a video ends | video_current_time, video_duration, video_percent, video_provider, video_title, video_url, visible (boolean) |
| view_search_results | When a user performs a site search (indicated by the presence of a URL query parameter) | search_term, optionally ‘q_<additional key=””>’ (where <additional key=””> matches an additional query parameter you specify to be collected under advanced settings) |
Creating Custom Events and Conversions
If GA4 does not automatically track the event you need to measure conversions, you can create custom events. There are a few ways to do this. We will cover three here.
Create a new event from an existing event
- In the property column of the admin panel, click on Events
- Click “Create Event” and click “Create”
- In “Custom Event Name” enter an event name (follow the event naming rules)
- Under “Matching Conditions” create one or more conditions that match previous events in your GA4 account. You can use regular expression with some execeptions.
Modify an existing event
This modifies an existing event overwrites existing parameters and should be used cautiously. However, it may be advantageous, because modified events are processed before custom events.
Modifying events may be used when you need to rename an event for reporting purposes.
- In the property column of the admin panel, click on Events
- Click “Modify” event, then “Create”
- Give your event modification a name under “Modification name”
- Under “Matching Conditions” specify your matching conditions.
- In “Modify parameters” change any parameter from the existing event.
- Click create
Fire a custom event tag through tag manager
- In Google Tag Manger, create a new tag. Under “tag configuration”, select your tag type, “Google Analytics: GA4 Event”
- Under “Configuration Tag” either select your GA4 tag or you can select to manually set the GA4 measurement ID.
- Give your event a name. Ensure your event name is:
- Under “Event Parameters” you can set additional event parameters to be captured with your event data. This can be useful for integrating ecommerce analytics in non-standard implementations.
- Set your trigger so that it only fires when this event occurs on the website.
- Save your tag and publish your container.
GA4 Event Naming Rules
Events in GA4 should follow the following naming conventions
- Event names are case sensitive
- Do not use automatically tracked event names as custom event names
- Event names must start with a letter
- DO NOT USE SPACES
Reserved event names
The following event names are reserved and should not be used:
- app_remove
- app_store_refund
- app_store_subscription_cancel
- app_store_subscription_renew
- click
- error
- file_download
- first_open
- first_visit
- form_start
- form_submit
- in_app_purchase
- page_view
- scroll
- session_start
- user_engagement
- view_complete
- video_progress
- video_start
- view_search_results
Audiences in GA4
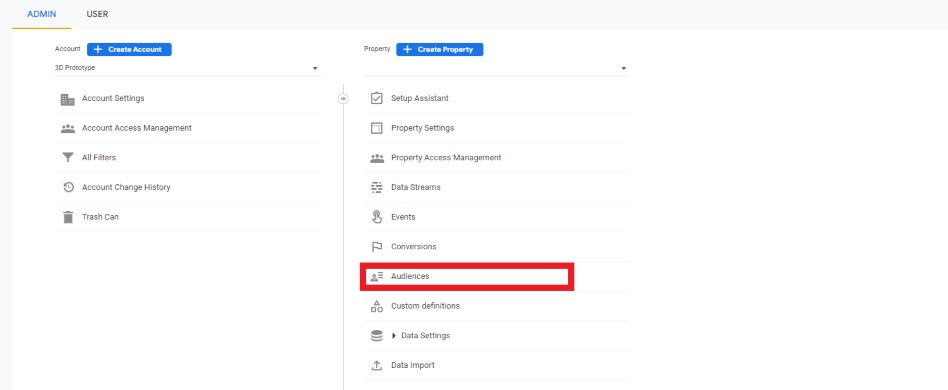
Audiences in GA4 is a collection of users that you can group together based on a number of combinations of attributes or experiences during a specific time frame. There is a limit of 100 audiences per property in GA4. To create an audience in GA4 you go to Admin > Property > Audiences. From there, select “New Audience” to create a new one.
Suggested Audiences in GA4
GA4 has custom, suggested, templates and predictive audiences that you can use that are partially configured audiences that use a set of dimensions and/or metrics. These include:
General Audiences
- Recently Active Users – users that have been active in a recent period
- Purchasers – users that have made a purchase
- Non-purchasers – users that have not made a purchase
- 7-day inactive users – users who were once active, but have not been active for the last 7 days
- 7-day inactive purchases – purchases who were once active, but have not been active for the last 7 days
Templates
- Demographics – segment users by demographic information
- Technology – segment users by their web or mobile technologies
- Acquistion – segment users by acquisition method
Predictive Audiences
Google will use machine-learning expertise to predict the future behaviour of your users. Currently, three metrics are available for predictive audiences:
- Purchase probability – The probability that a user who was active in the last 28 days will log a specific conversion event within the next 7 days.
- Churn probability – The probability that a user who was active on your app or site within the last 7 days will not be active within the next 7 days.
- Predicted revenue – The revenue expected from all purchase conversions within the next 28 days from a user who was active in the last 28 days.
For Purchase and Revenue prediction metrics, only purchase/ecommerce_purchase and in_app_purchase events are supported. Google lays out what requirements are needed to be able to access predictive audiences.
Audience Conditions in GA4
These are the conditions available to use when building an audience in GA4 .
Scope Conditions
- Across all sessions – all conditions must be met during the lifetime of the user
- Within the same session – all conditions must be met within the same session
- Within the same event – all conditions must be met in a single event
Dimension Conditions
You can select either static or dynamic dimensions. If you don’t select an option, the user evaluation for an audience will be dynamic. Static means that if the user met the condition at any point, they will be included.
Metric Conditions
You can use time-windowed metrics by selecting the Time Period option.
Event Conditions
You can use dynamic lookback for events as a condition when the scope is Across all Sessions and by selecting the event_count parameter.
How to Create a Custom Audience in GA4
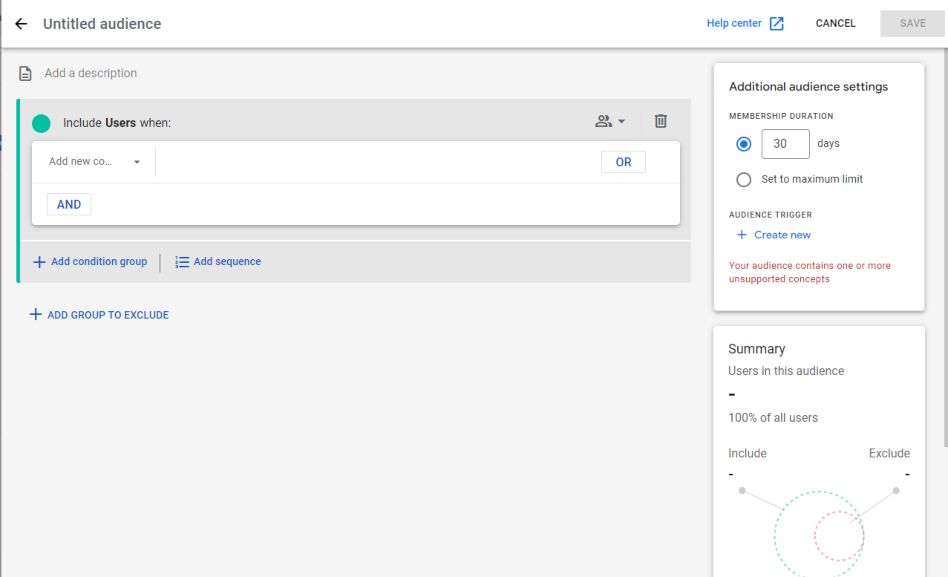
- Go to the Admin Panel
- In the Property Column, click Audiences > New Audience
- Select ‘Create a custom audience’
- Enter the name of the audience and a description
- Add conditions (scope, dimensions, metrics, events)
- Add condition group (if applicable)
- Add sequence (if applicable)
- Add group to exclude (if applicable)
- Add membership duration
- Click Save
How to Edit an Audience
If you need to edit your custom audience configuration the option is limited for what you can change. Here’s what you can change:
- The name of the audience
- The description of the audience
- Adding an audience trigger
Because audiences are retroactive, you cannot change their conditions. To change the basic information, navigate to the Audience section from the Admin panel. Select the three dots next to the audience Management table.
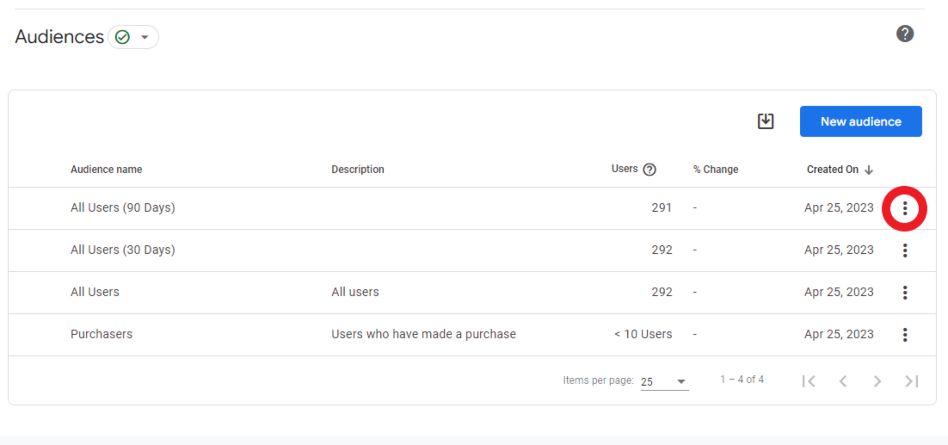
You can also duplicate an audience or archive it which you should do instead of deleting an audience.
Adding GA4 Audiences in Google Ads
You can use audiences you configure in GA4 in Google Ads which can you use as targeting options for your ads.
- Activate Google Signals by going to Admin > Data Settings > Data Collection and clicking Get Started and Activate
- Make sure your Google Ads account is linked to your GA4 property
- In the Google Ads connection, make sure ‘Enable Personalized Advertising’ and ‘Enable auto-tagging” is selected
- Navigate to your Google Ads Account and go to Tools & Settings > Shared Library > Audience Manager
- Your available audiences will be available to select
Custom Dimensions in GA4
GA4 allows you to create customized dimensions where you can analyze data that is specific to your business needs. Before you create custom dimensions, review the default dimensions that Google has already created. Before you start, make sure that you are an Editor or Administrator on the account.
Types of Scopes
You can choose between three different types of scopes for custom dimensions:
Event
It provides information about an action that a user has performed such as the title of an article someone viewed.
User
It provides information about the user who performed the action such as the profession of the person who viewed the article.
Item
It provides information about the product of services that users interact with in an event such as the colour of an item that the user purchased.
Adding a Custom Dimension
To add a custom dimension, go to the Admin panel in GA4. From there, you want to click on the Custom definitions box in the Property column.
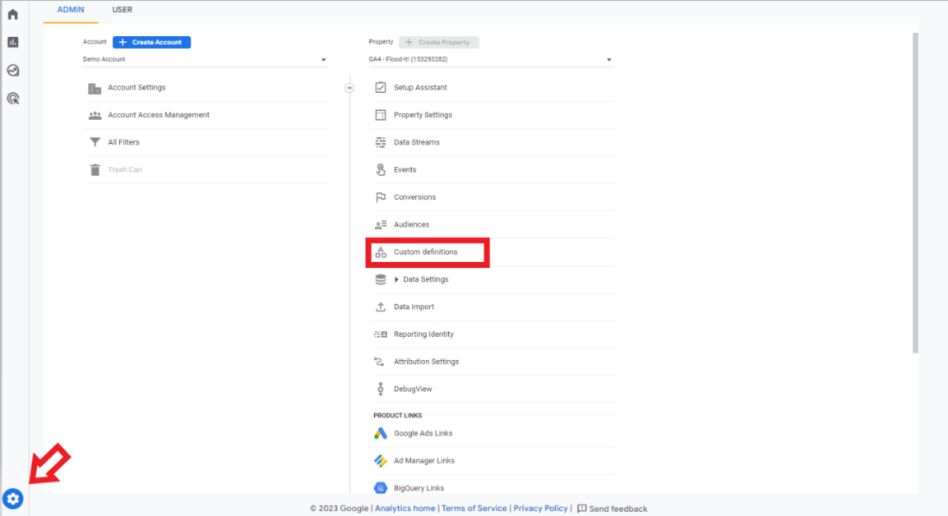
From there, you’ll enter a new screen where you will see either a blank area (if you haven’t created any custom dimensions yet) or viewing your current custom dimensions. Select the ‘Create custom dimensions’ box.
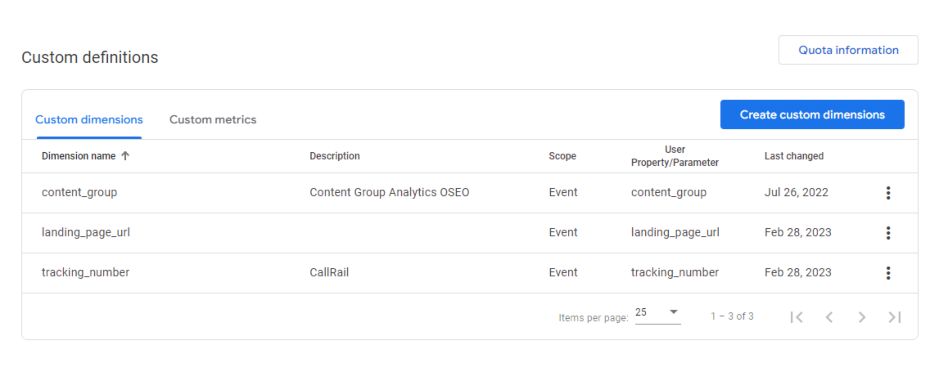
A separate box will open where you will fill out the following information:
- Dimension name
- Scope
- Description (this isn’t necessary but is helpful as it provides detail about the dimension)
- Event parameter
Once you have filled out the necessary information, hit Save. You can also certain elements of the dimension once you have saved it.
Traffic filters
The implementation of traffic filters in GA4 is a multi-step process that differs significantly from the filter implementation you may be used to in UA. In both platforms, filters only apply from the date they are applied. Filters permanently remove data from your account, so they should be applied cautiously.
How to setup an internal traffic filter in GA4
- First, in the Admin panel, go to “Data Streams” and select your data stream
- Under “Google Tag” go to “Configure tag settings”
- Under “Settings” click “Show All”
- Go to “Define Internal Traffic”
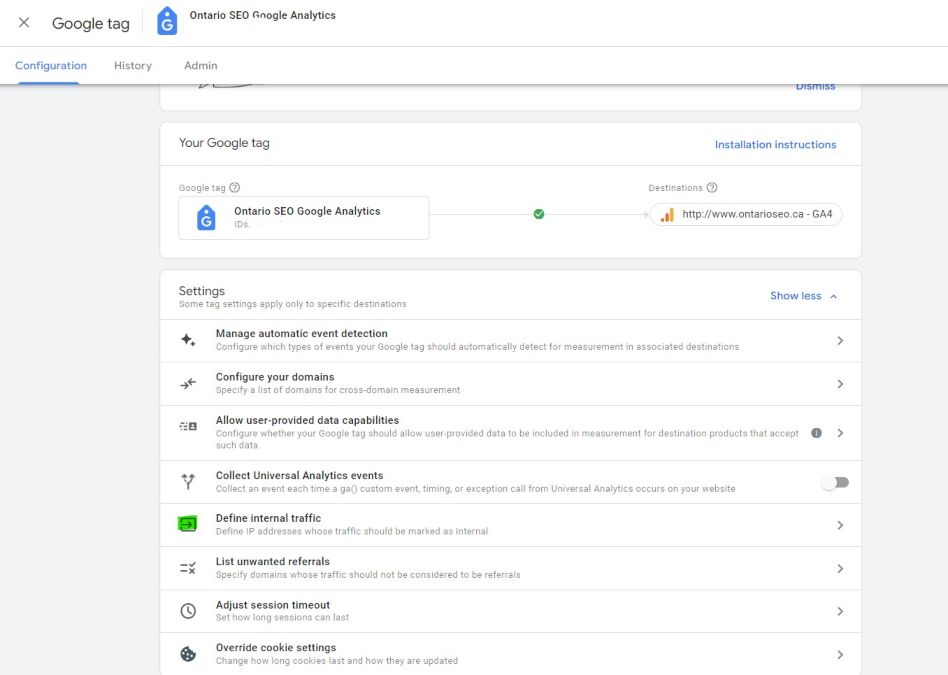
- Hit “Create” and give your rule a name. Use the default “traffic_type” value: internal
- Set the conditions for your IP addresses that should be excluded then hit “Create
These steps tag your internal traffic in your reporting. The next step is to remove it from your data collection.
- Go to the Admin panel and select “Data Settings” then “Data Filters”
- Hit “Create Filter” and select “Internal traffic”
- Choose your filter type: “Internal Traffic”
- Name your internal traffic filter and set the filter operation to “Exclude”
- Set the “traffic_type” parameter to match exactly what you chose in step 5 of the previous section (internal)
- At this point you can choose to set you filter to “testing” or “active” and hit “Create”.
We recommend testing your internal traffic filter for a week or two to ensure it is working as expected. You should be able to view your internal traffic by setting the parameter to “traffic_type” in your acquisition reporting.
Connecting to Google Ads
If you have your Google Ads account connected to Universal Analytics, you will need to change it to GA4 once the deadline approaches. Connecting your GA4 properties to Google Ads ensures that they will continue to work, pull in data, and be included in reports.
Integrated Google Ads with GA4
- In your GA4 property, go to the Admin panel at the bottom left of your screen.
- In the Property column, scroll to the bottom to see the Product Links section.
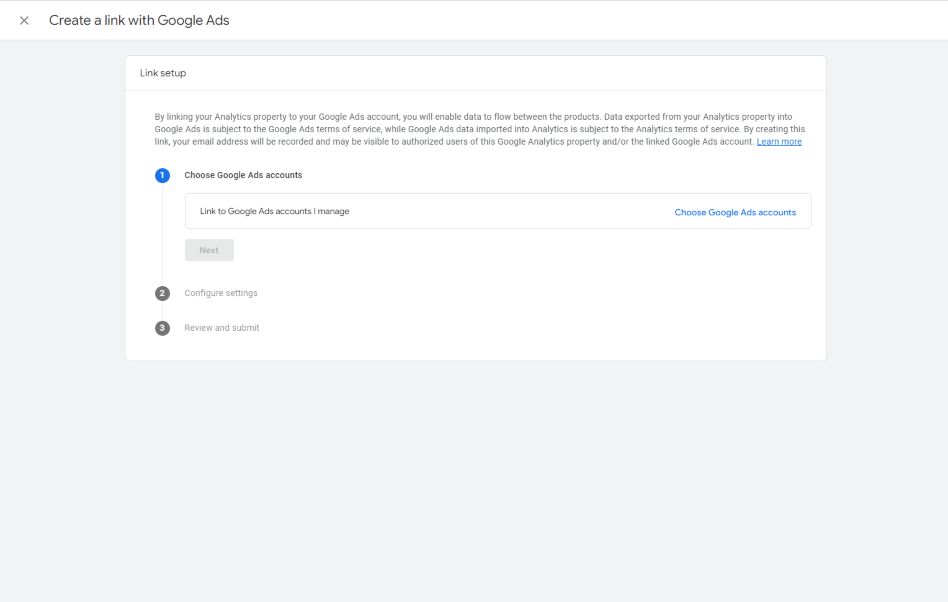
- Click on Google Ads Links
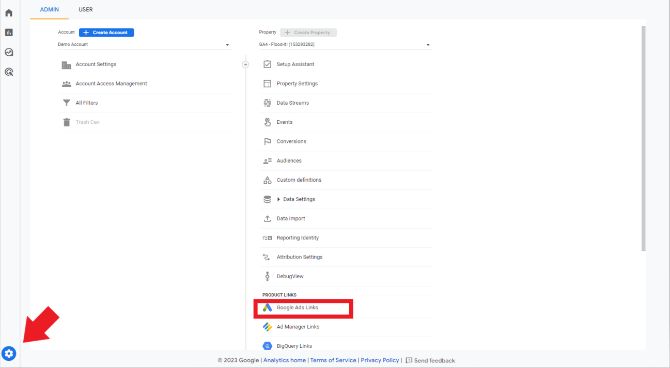
- After clicking it, you’ll see an option to Link. Click on it
- Choose the Google Ads account that you want associated with that GA4 property
- Click Confirm
Configuring GA4 Conversions in Google Ads
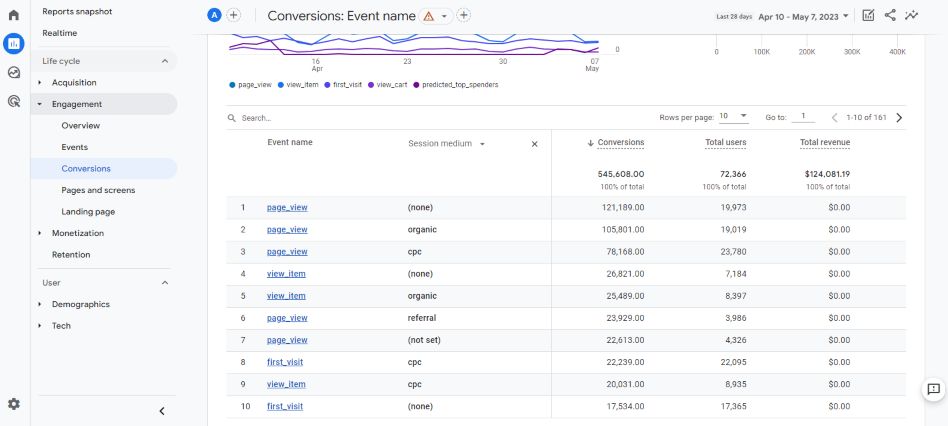
Once Google Ads is connected to GA4, you need to import your conversions into Google Ads. Before completing this step, review that your conversions are working correctly in GA4 and closely match conversions you had previously in UA. Once added, review that the conversions are aligned in both platforms.
To review that conversions are properly showing in GA4, go to Reports > Engagement > Conversions. From there, you can narrow down the data by including Session medium to see your paid conversions.
UTM Parameters and GA4
How to view UTM Parameters in GA4
To access the Traffic Acquisition Report in GA4, navigate to the Reports section within your GA4 property. Next, select the option labeled “Traffic Acquisition,”.
Once you’re in the report, you’ll find your website traffic categorized by different traffic channels. To modify how your traffic is grouped, click on the small dropdown arrow located to the left of the blue plus sign. By clicking on the plus sign, you can add a secondary dimension to the report. In Google Analytics, a “dimension” refers to a descriptive attribute or characteristic of data. Adding a secondary dimension means incorporating a second attribute to aid in the analysis of your traffic data.
By adding a secondary dimension, you can examine your data aggregated according to various UTM parameters. These parameters include Session manual ad content (utm_content), Session manual term (utm_term), Session medium (utm_medium), and Session source (utm_source), which are presented alongside the Traffic Source dimensions. You have the option to add any of these dimensions as secondary dimensions. Alternatively, you can change your primary dimensions to one of your UTM parameters and then introduce a secondary dimension to further analyze the traffic from your tagged campaigns.
New UTM Parameters
When comparing UA (Universal Analytics) and GA4 (Google Analytics 4) in terms of UTM tracking, one of the key distinctions lies in the level of granularity and customization provided.
GA4 allows a broader range of UTM parameters to be viewed in the platform compared to UA, granting you greater control over the data collection process and enabling tracking of more specific campaign information. Alongside the standard UTM parameters, GA4 introduces four additional parameters.
Standard Parameters:
- utm_source: Refers to the traffic’s referrer or source.
- utm_medium: Describes the referral type, such as email, social, or organic.
- utm_campaign: Specifies the campaign’s name.
- utm_term: Represents the search term used to discover your website.
- utm_content: Indicates the particular content or ad that the user clicked on.
New parameters:
- utm_source_platform: Identifies the platform responsible for directing the traffic.
- utm_creative_format: Describes the ad format, such as video or display.
- utm_marketing_tactic: Specifies the targeting settings for the ad, including prospecting, remarketing, etc.
- utm_id: This parameter represents the ID assigned to the specific campaign
GA4 surpasses UA in terms of UTM tracking capabilities by offering a wider range of UTM parameters and advanced features like cross-device tracking. These enhanced functionalities provide you with increased control over data collection and enable the tracking of more precise campaign information. Utilizing this data empowers you to make informed decisions regarding campaign optimization and drive higher conversion rates.